Detecting manually mapped drivers
Manually mapping kernel mode drivers was always a common thing in the game hacking scene, but some anticheats were still not very mature. So, at least public projects usually focused on changing the value of g_CiOptions to disable driver signing enforcement, loading their unsigned driver, and then playing with some DKOM to make it harder to find.
In 2019, though, a nuclear bomb was dropped into the scene. That nuclear bomb was a project called kdmapper.
If you have ever worked on anything remotely close to Windows internals, game hacking, or malware reversing, you most likely already know this project. Instead of using some vulnerable driver (a driver that exposes kernel memory r/w to user mode) to bypass DSE, it directly allocated memory in the kernel, copied the PE image into it, resolved its imports, and then called the entry point.
For the first few months (at least it felt like that at the time), it was a free-for-all game. People had been mapping random crap into the kernel without even understanding how any of it worked, and because most of the anticheat software at the time was not doing proper checks, they were getting away with it. After some time, though, anticheats started catching up, first by checking the most obvious things like IOCTL dispatch overwrites (they should always point to legitimate drivers’ memory regions), hooks by pointer swaps, running system threads with stack traces out of legitimate memory regions, etc. Later on, they started sending APCs or registering NMI callbacks, but most importantly, they also started proactively searching for those drivers in memory, and that’s what this article is about.
Where do we start?
If we want to scan the entire system, we pretty much have two options:
- Walk page tables to find all valid executable pages.
- Search all valid physical memory ranges.
I picked the second option for my demonstration since it was quicker to write.
Here is the code that I will be using:
const PPHYSICAL_MEMORY_RANGE physicalMemoryRanges = MmGetPhysicalMemoryRanges();
if (!physicalMemoryRanges)
{
    Log("Failed to get physical memory ranges!");
    return;
}

Log("Starting memory scan (this can take a while)...");
constexpr SIZE_T CHUNK_SIZE = PAGE_SIZE;
for (int i = 0; physicalMemoryRanges[i].BaseAddress.QuadPart || physicalMemoryRanges[i].NumberOfBytes.QuadPart; i++)
{
    const PHYSICAL_ADDRESS start = physicalMemoryRanges[i].BaseAddress;
    const SIZE_T totalSize = static_cast<SIZE_T>(physicalMemoryRanges[i].NumberOfBytes.QuadPart);

    for (SIZE_T offset = 0; offset < totalSize; offset += CHUNK_SIZE)
    {
        PHYSICAL_ADDRESS chunkStart;
        chunkStart.QuadPart = start.QuadPart + offset;
        const SIZE_T chunkSize = min(CHUNK_SIZE, totalSize - offset);

        MM_COPY_ADDRESS address;
        address.PhysicalAddress = chunkStart;

        SIZE_T bytesRead;
        status = MmCopyMemory(CheckBuffer, address, chunkSize, MM_COPY_MEMORY_PHYSICAL, &bytesRead);

        if (!NT_SUCCESS(status) || bytesRead != chunkSize)
            continue;

        // TODO
    }
}
Cool, now what?
Now we have access to (almost) the entire memory and we can perform some heuristic scans on it, but what do we do? The first thing that probably comes to your mind is the DOS and NT headers that each PE executable has. Unfortunately (for us), though, literally every manual mapper ever in existence either zeroes them or does not copy them to the kernel at all. So, what do we search for then?
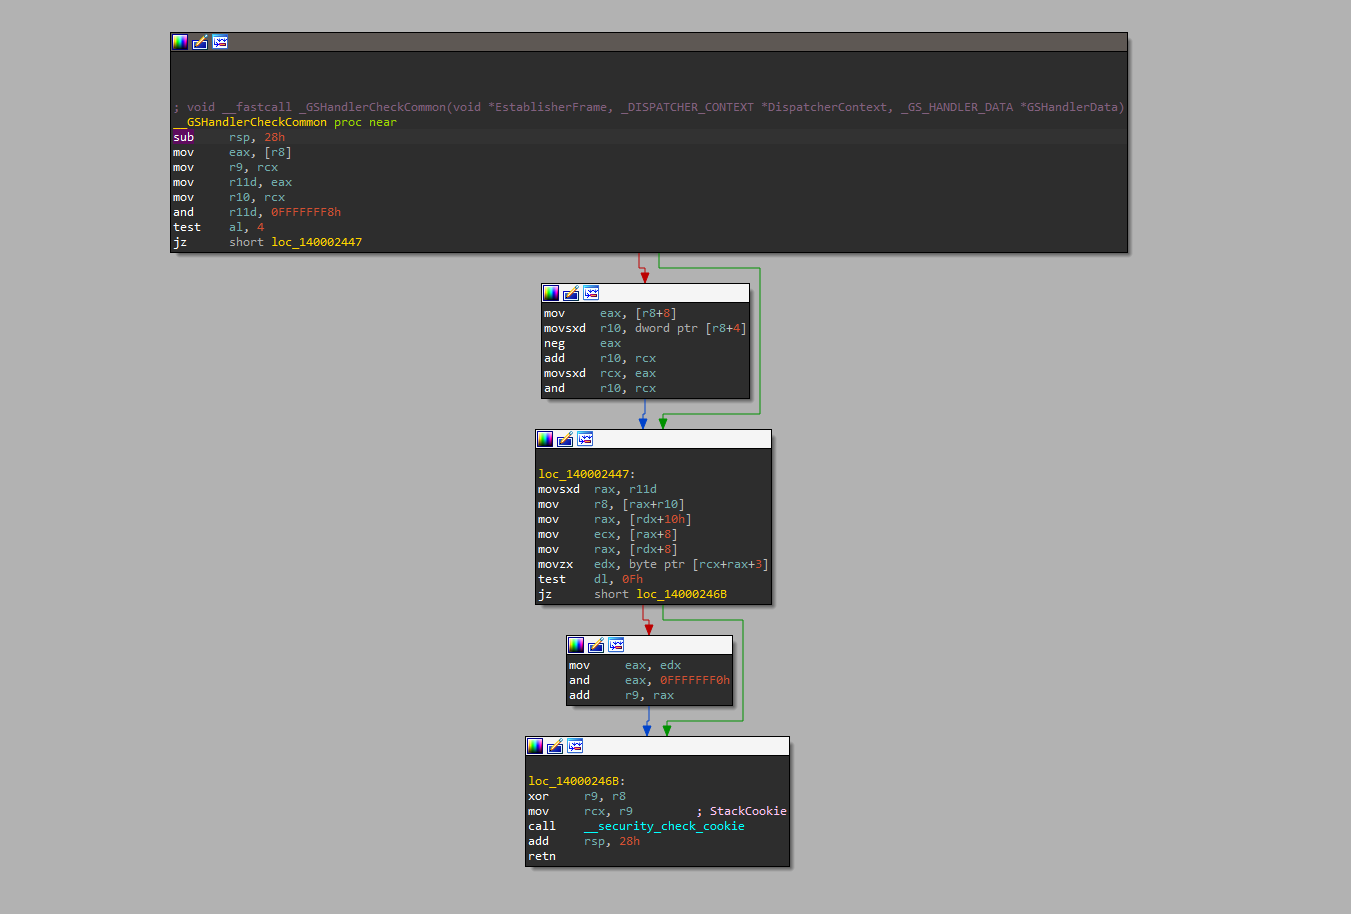
If the driver was compiled using MSVC with all sorts of exploit mitigations enabled, like Control Flow Guard, Buffer Security Check/Security Cookie, and Spectre mitigations, there will be compiler-generated code that is always going to be the same across any compiled image that we could search for.
__GSHandlerCheckCommon - Security check handler
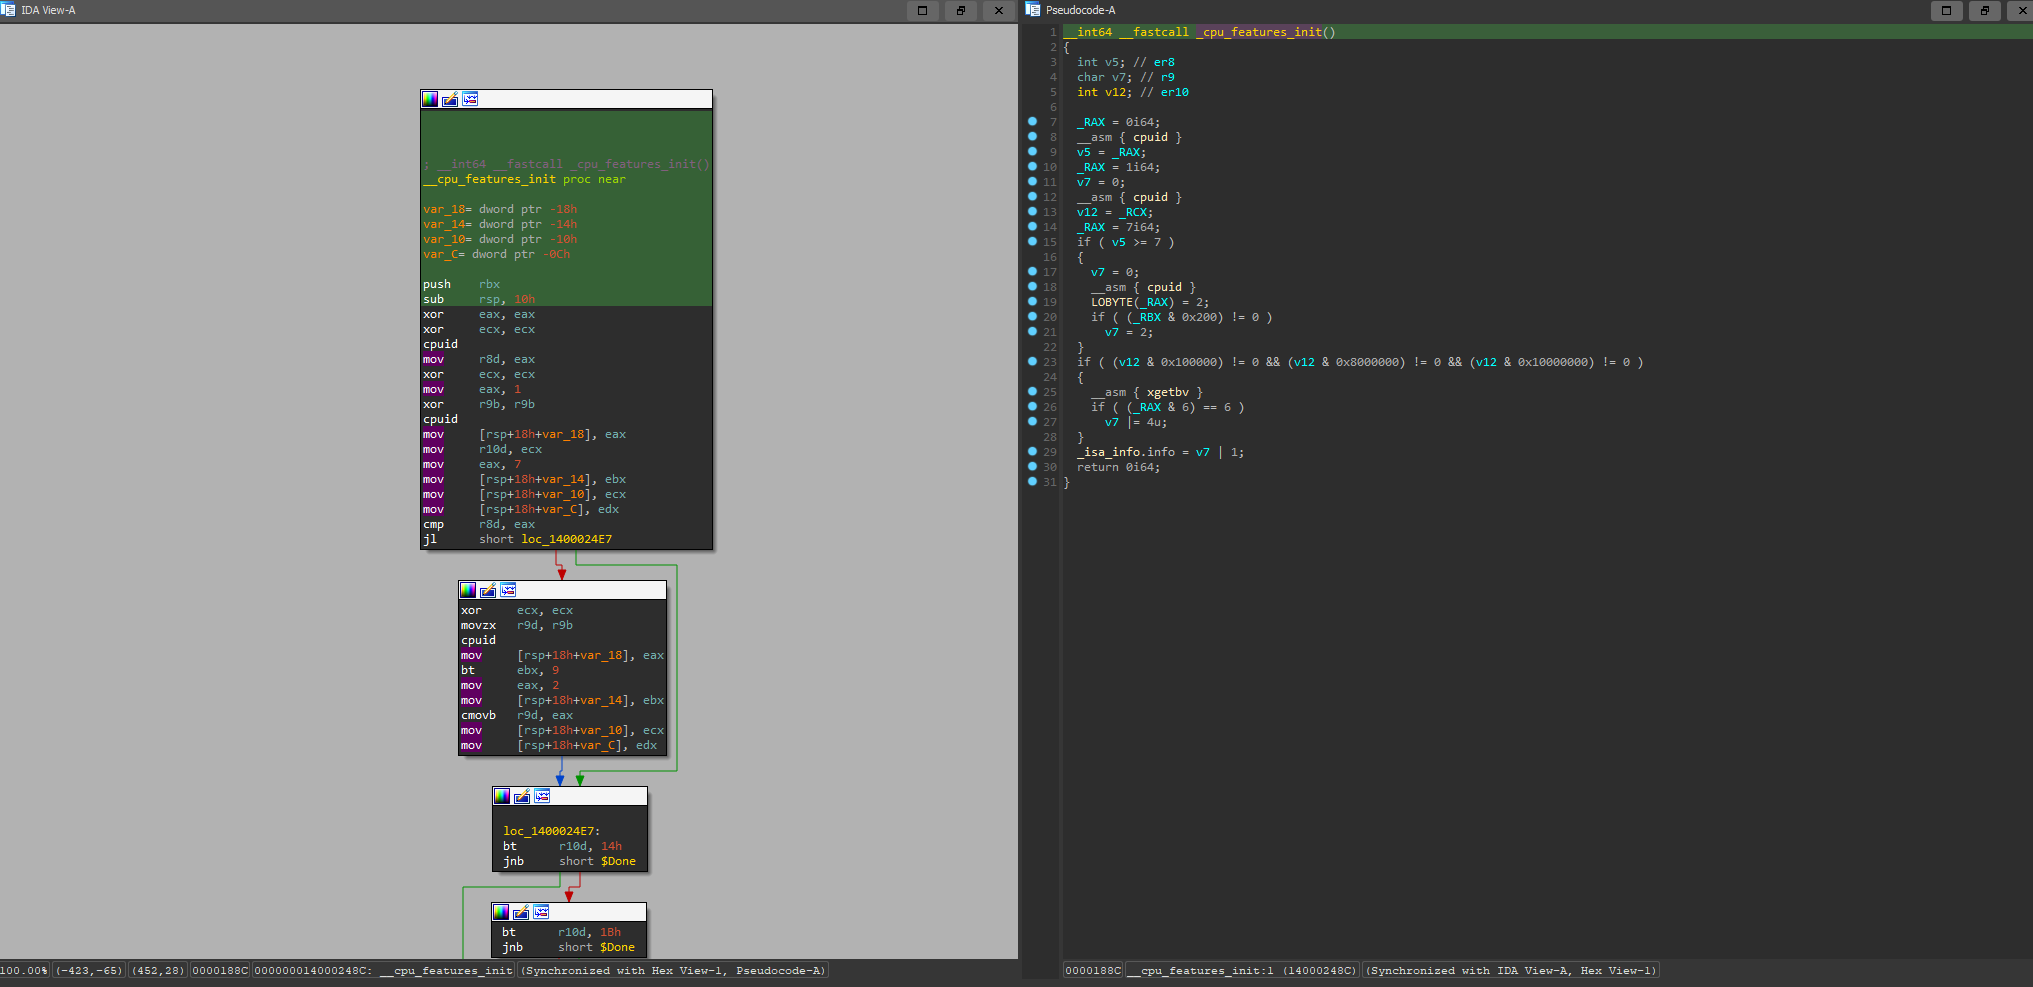
There are even some standard library functions that will always be statically linked into the driver.
_cpu_features_init - memset uses it to check if SSE or AVX is enabled
memset - Standard library function
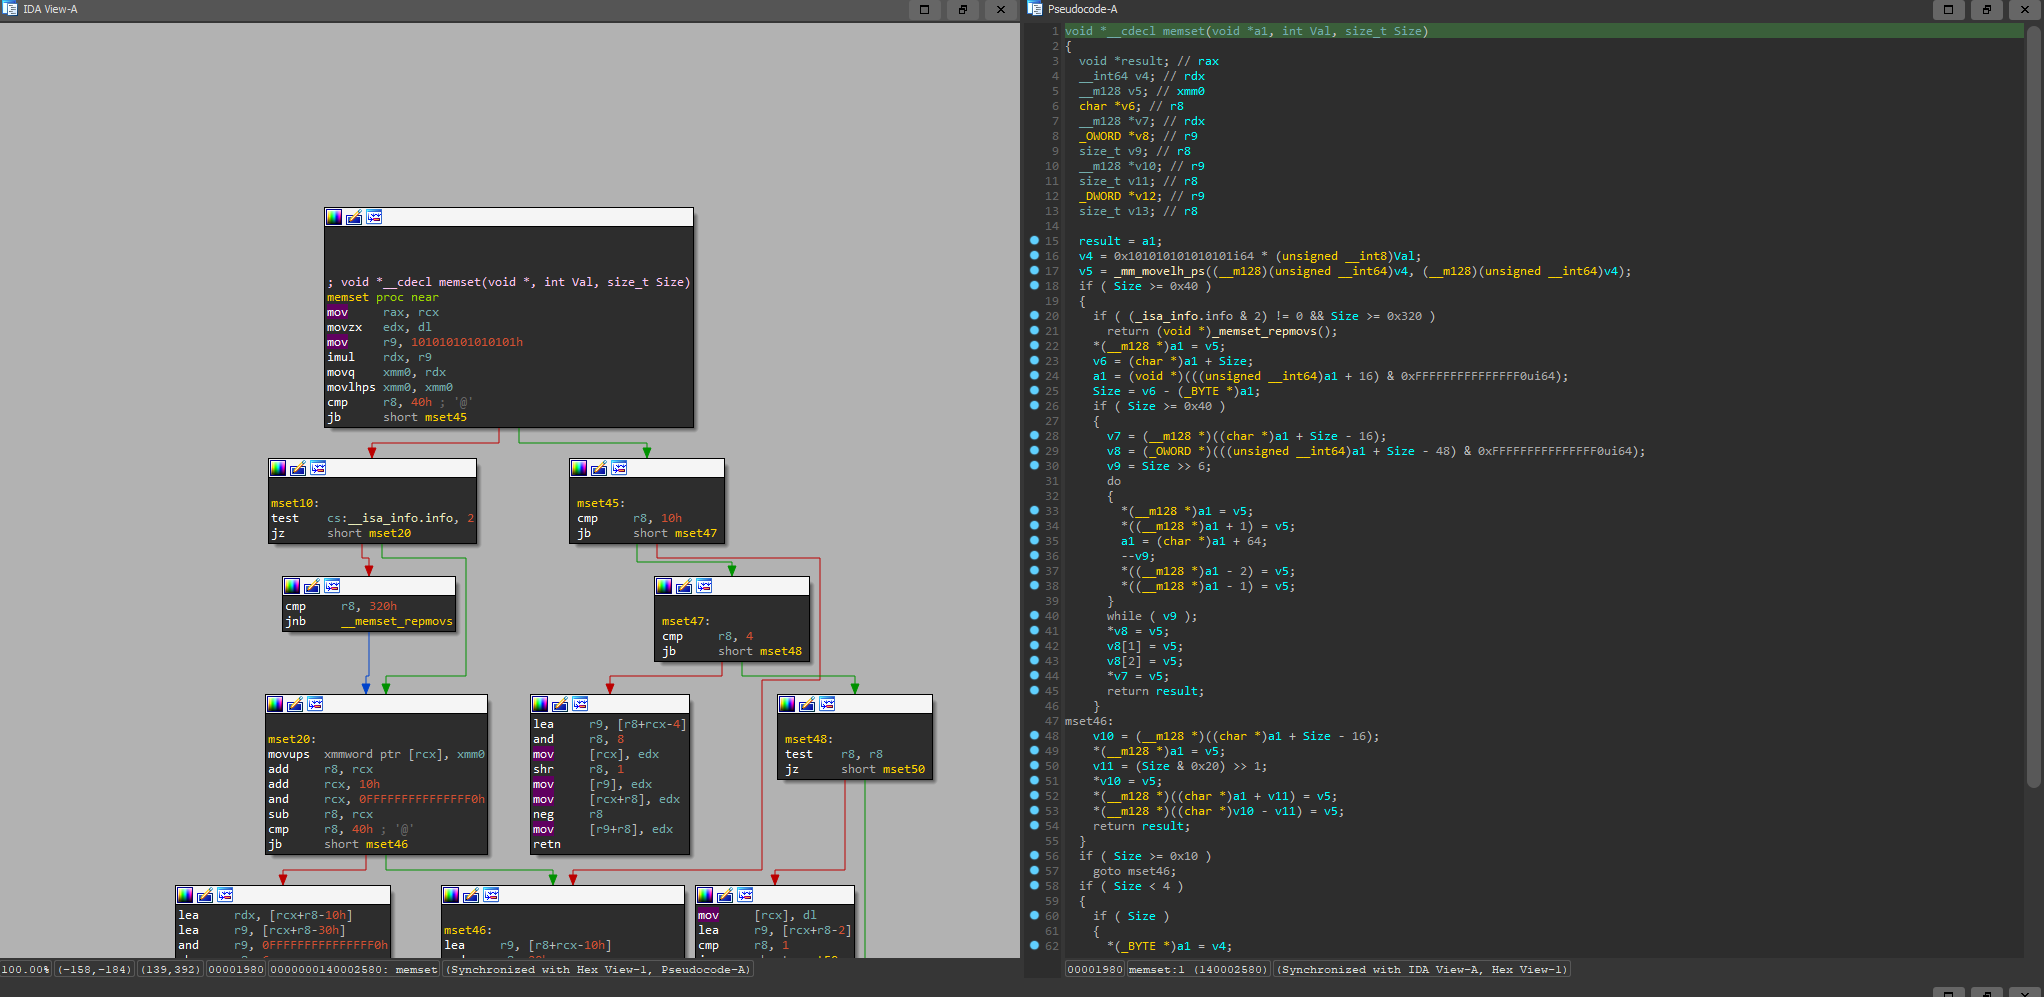
This looks like the optimal choice: create patterns out of them and search the memory. If you find the pattern outside of any legitimate module region, you have most likely found a manually mapped driver. The problem?
- Each compiler version is going to produce different output, so you will need to check for lots of patterns to get actual matches.
- False flags are very likely due to UEFI firmware (
memset, for example). You could filter out firmware entries, but that’s out of the scope of my little experiment. - Certain compiler settings might change the output.
I wanted something incredibly simple that would still have a high detection rate and a low false positive rate. I am going to assume that most of the drivers are compiled using MSVC. There is one thing about it specifically that we can use:
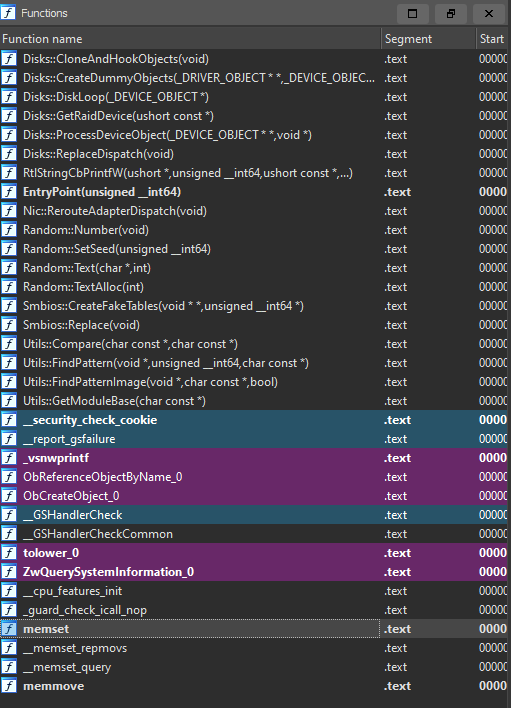
Do you see it already?
Even when you change all sorts of possible compiler options, it will always generate those wrapper functions around certain imports.

I’ve checked many drivers that I have made myself in the past and even ones that I was reversing, and to my surprise, all of them had those import wrappers. The only one that had none was (ironically) kdmapper’s HelloWorld driver (since it has only one import, it was just inlined).
The actual detection
Now that we have figured out what we are going to be searching for, we could finally go ahead and implement the search algorithm.
- Find all absolute indirect jump instructions (
FF 25). - Check whether the instruction is within some kernel module address.
- If not, resolve the (assumed) import address.
- Read the import and check whether it points to the kernel (
ntoskrnl.exe).
If all those conditions are met, we have most likely found a manually mapped driver.
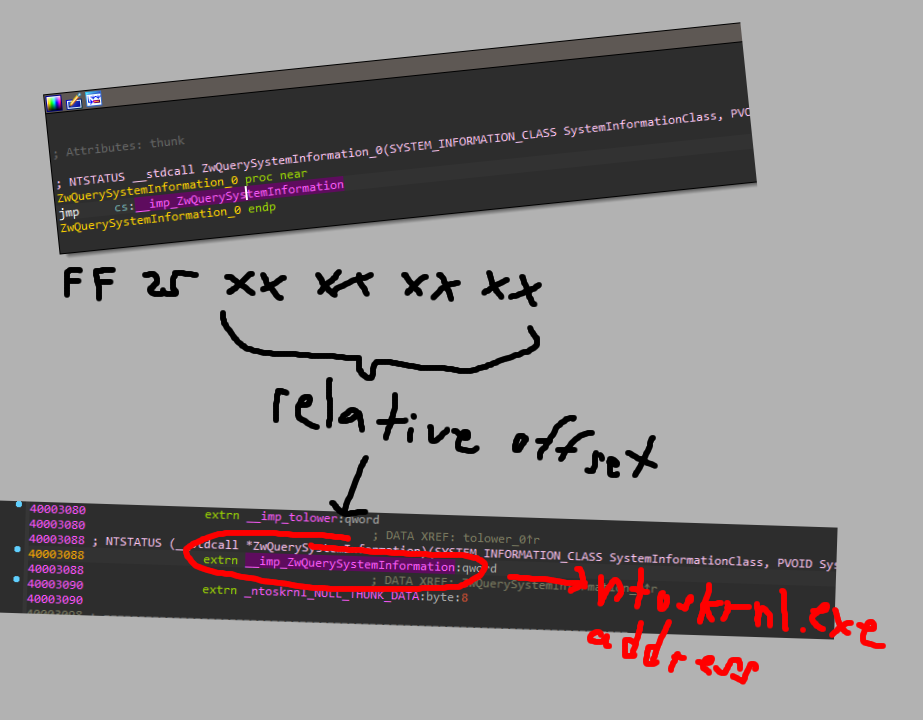 I heard good blog articles need fancy visual representations, so here is one.
Here is the code:
bool Detector::IsValidKernel(ULONG64 address)
{
    const PRTL_PROCESS_MODULE_INFORMATION ntoskrnl = &SystemModules->Modules[0];
    const ULONG64 ntoskrnlStart = reinterpret_cast<ULONG64>(ntoskrnl->ImageBase);
    const ULONG64 ntoskrnlEnd = ntoskrnlStart + ntoskrnl->ImageSize;

    if (address >= ntoskrnlStart && address < ntoskrnlEnd)
        return true;

    return false;
}

bool Detector::IsValidAny(ULONG64 address)
{
    for (ULONG_PTR i = 0; i < SystemModules->NumberOfModules; i++)
    {
        const PRTL_PROCESS_MODULE_INFORMATION current = &SystemModules->Modules[i];
        const ULONG64 moduleStart = reinterpret_cast<ULONG64>(current->ImageBase);
        const ULONG64 moduleEnd = moduleStart + current->ImageSize;
        if (address >= moduleStart && address < moduleEnd)
            return true;
    }

    return false;
}

// In the previous loop
bool foundGadget = false;
for (SIZE_T j = 0; j < chunkSize - 1; j++)
{
    if (CheckBuffer[j] == 0xFF && CheckBuffer[j + 1] == 0x25)
    {
        ULONG64 physicalFound = chunkStart.QuadPart + j;
        ULONG64 virtualFound = Utils::PhysicalToVirtual(physicalFound);

        // FF 25 XX XX XX XX
        int instructionOffset;
        Utils::ReadVirtualMemory(virtualFound + 2, instructionOffset);

        ULONG64 resolved;
        Utils::ReadVirtualMemory(virtualFound + instructionOffset + 6, resolved);

        if (!resolved)
            continue;

        if (!IsValidKernel(resolved))
            continue;

        if (IsValidAny(virtualFound))
            continue;

        TotalGadgets++;
        foundGadget = true;

        Log("Found at 0x%llx (0x%llx)", virtualFound, physicalFound);
    }
}
Now, let’s try to run the code on a system without any manually mapped drivers.
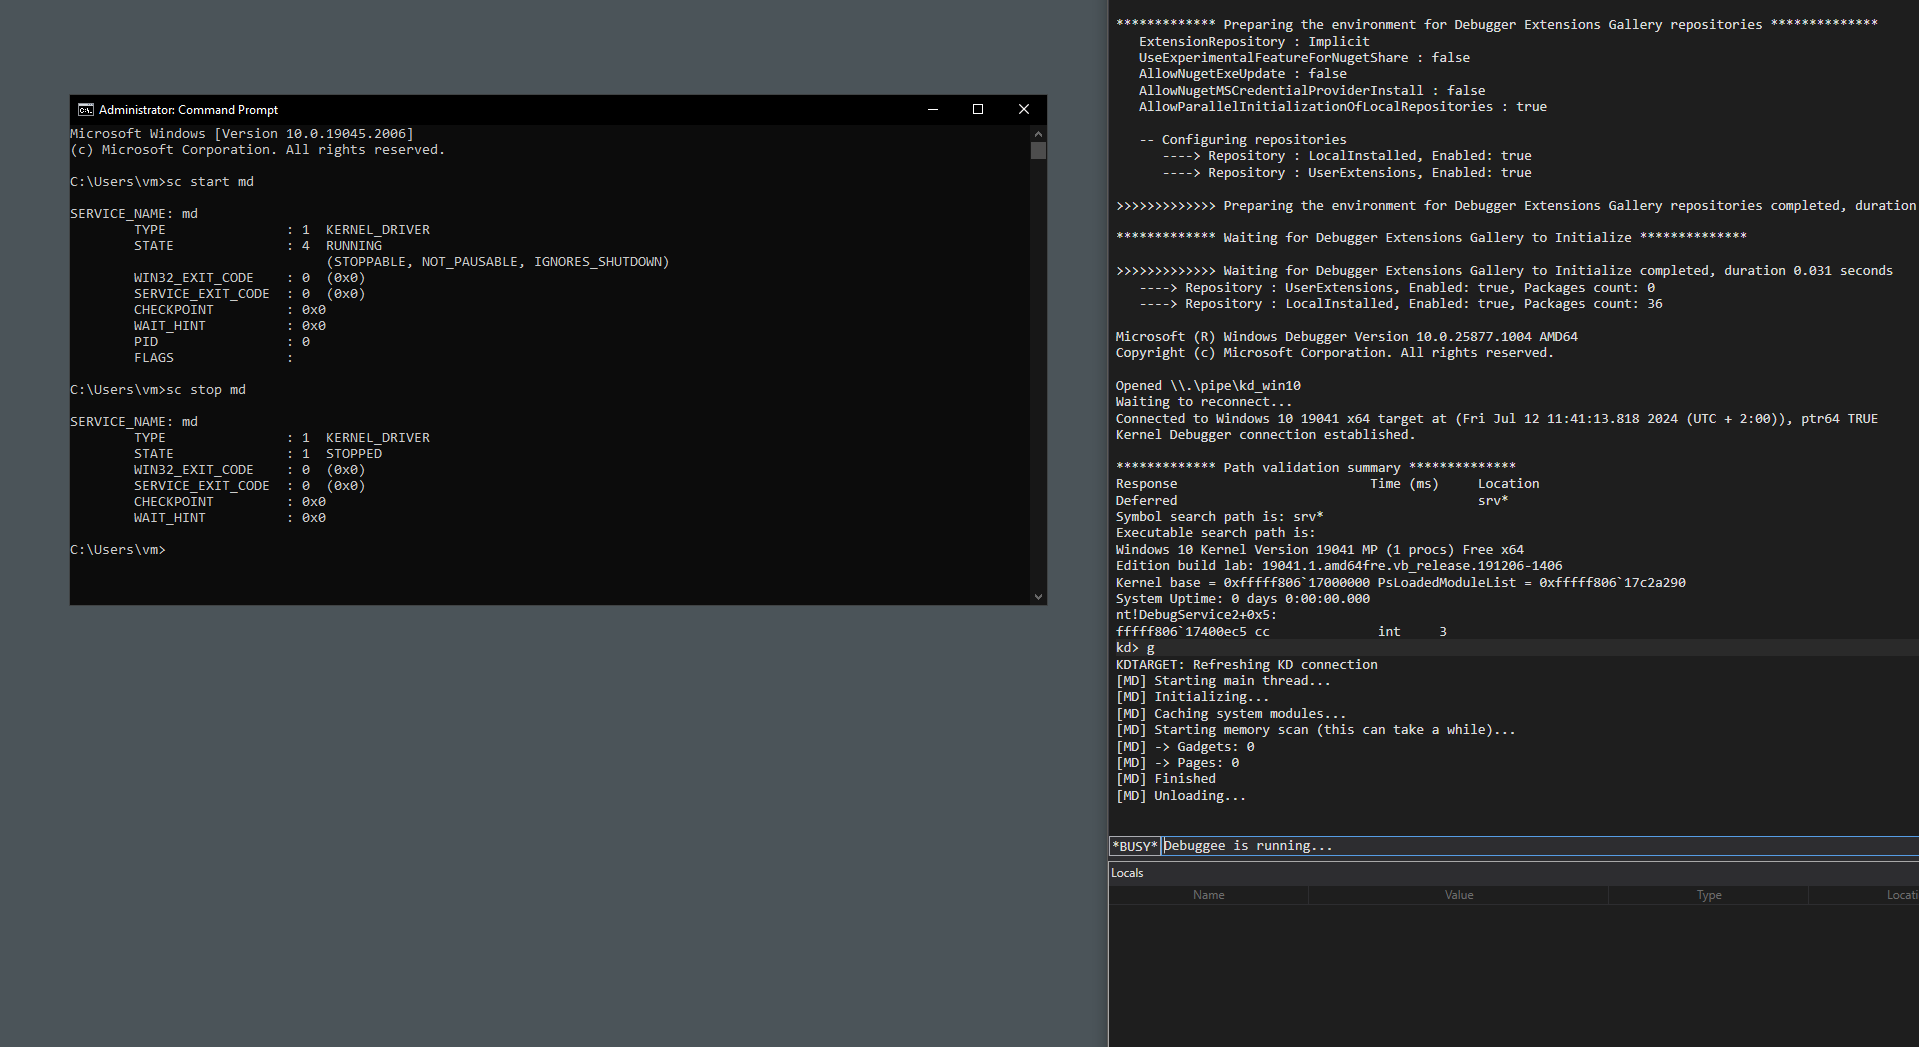
[MD] Starting main thread...
[MD] Initializing...
[MD] Caching system modules...
[MD] Starting memory scan (this can take a while)...
[MD] -> Gadgets: 0
[MD] -> Pages: 0
[MD] Finished
[MD] Unloading...
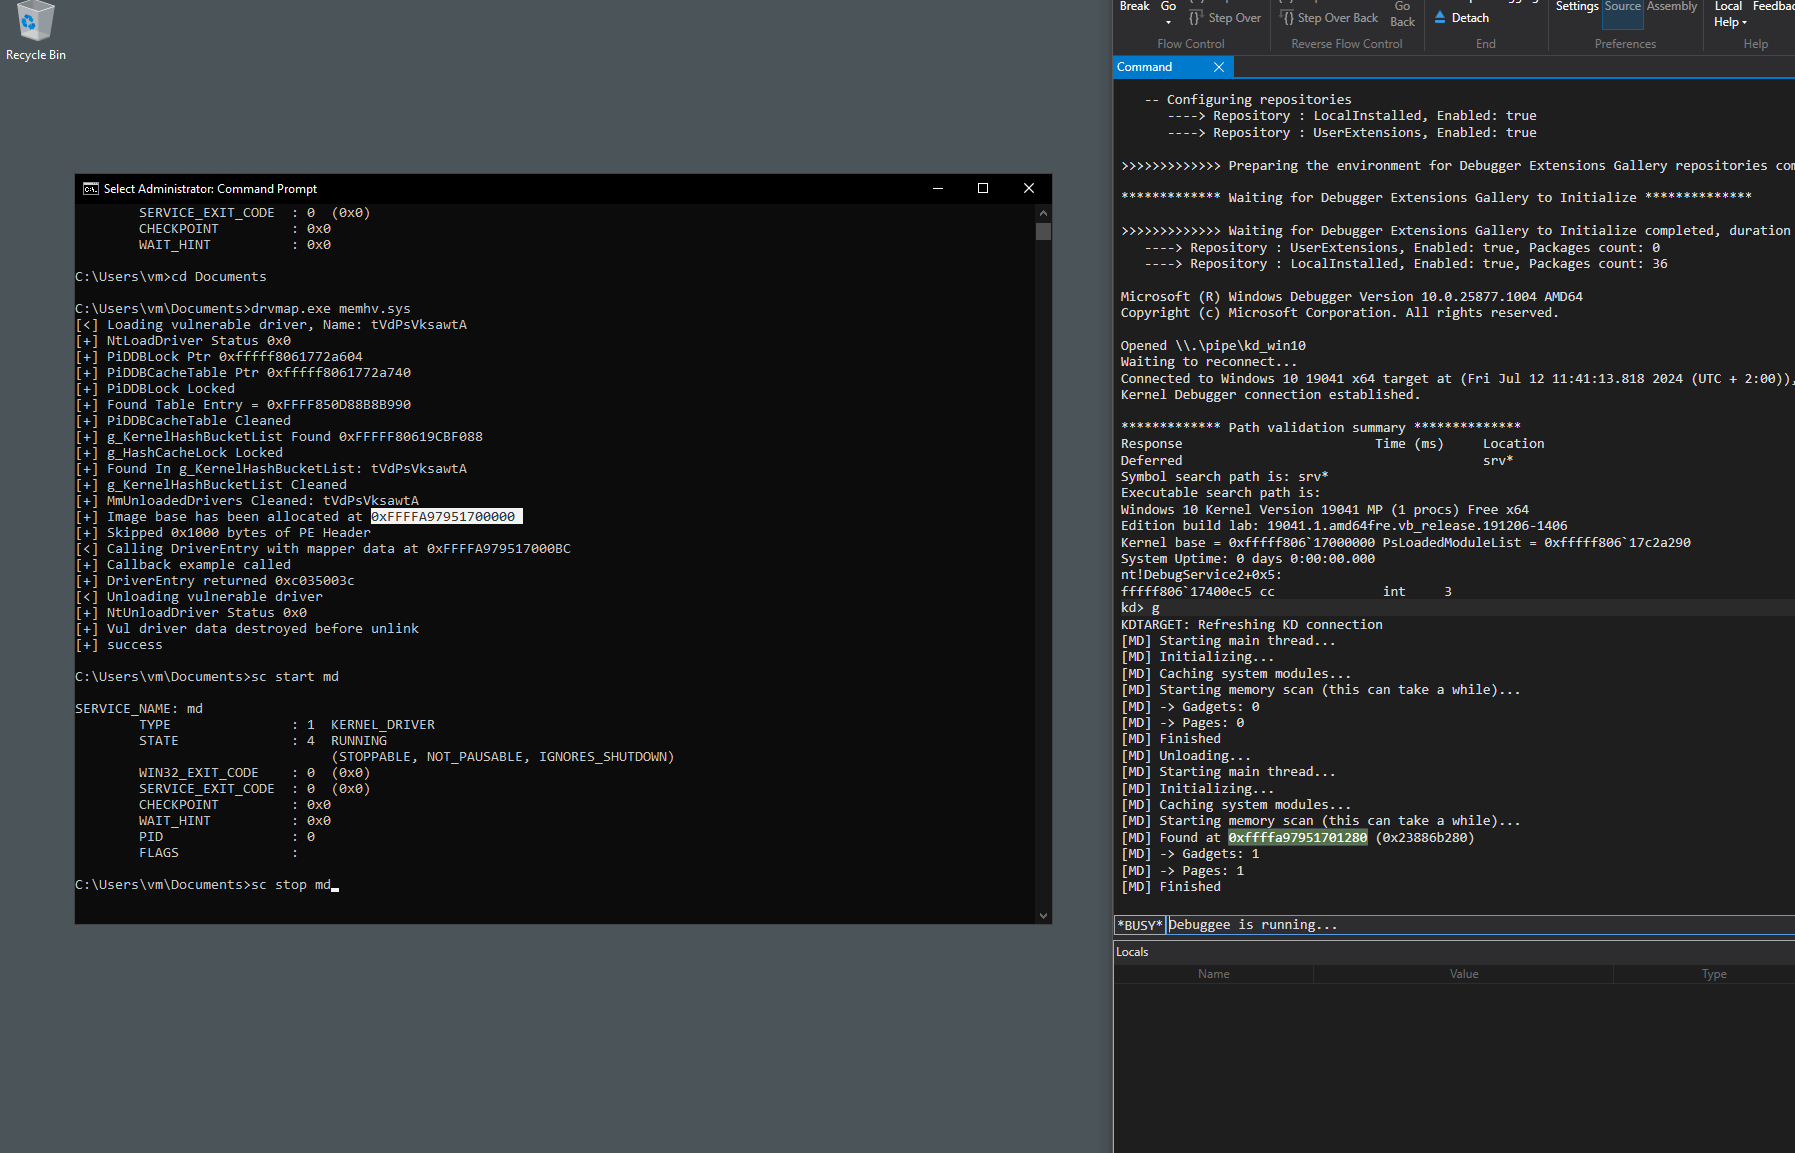
Now, lets try to map some random driver.
[MD] Starting main thread...
[MD] Initializing...
[MD] Caching system modules...
[MD] Starting memory scan (this can take a while)...
[MD] Found at 0xffffa97951701280 (0x23886b280)
[MD] -> Gadgets: 1
[MD] -> Pages: 1
[MD] Finished
As you can see, it has found the import wrapper in a region that is not associated with any loaded module. I have also tried this with several other drivers of mine and a few binaries that I have found around the internet.
What’s the point though?
I am writing this article because there are still some people who believe they can just map their driver, swap some random pointer, and they are good to go. This is not true with practically any modern anticheat. As you could see in the example above, even I could, in a few hours, figure out how to (somewhat) reliably detect the presence of those drivers. Now imagine what modern anticheats do. Most of them will find the mapped driver, dump it, and send it to their servers for further analysis. If that driver then ever becomes flagged as a cheat, everyone who ever had it loaded will get banned retrospectively.
I would not be surprised if, in the future, anticheats decide to do some more crazy stuff, like making the page non-executable, then waiting for an exception to be thrown and utilizing HAL exception hooking to check the stack trace.